Distributed tracing with Knative, OpenTelemetry and Jaeger 
Published on: 2021-08-30 , Revised on: 2024-01-17
Distributed tracing with Knative, OpenTelemetry and Jaeger
Author: Ben Moss, Software Engineer @ VMware
When trying to understand and diagnose our systems, one of the most basic tools we learn to lean on is the stack trace. Stack traces give us a structured view of the flow of logic that our program is executing in order to help us wrap our heads around how we got into a certain state. Distributed tracing is our industry's attempt to take this idea and apply it at the next higher level of abstraction and give us a view of the way that messages flow between programs themselves.
Knative Eventing is a set of building blocks for wiring up the kind of distributed architecture that is favored by many these days. It gives us a language for describing and assembling the connections between programs, through brokers, triggers, channels and flows, but with this power comes the risk of creating a pile of spaghetti where determining how events were triggered can become difficult. In this post we’re going to walk through setting up distributed tracing with Eventing and see how it can help us better understand our programs and a bit about how Eventing works under the hood as well.
The lay of the tracing landscape
One of the first problems that comes with trying to learn about how to do tracing is just wrapping your head around the ecosystem: Zipkin, Jaeger, OpenTelemetry, OpenCensus, OpenTracing, and countless more, which one should you be using? The good news is that these last three “Open” libraries are attempts to create standards for metrics and tracing so that we don’t need to decide right away what storage and visualization tools we’ll use, and that switching between them should be (mostly) painless. OpenCensus and OpenTracing both started as a way of unifying the fractured landscape around tracing and metrics, resulting in a tragic/hilarious set of new divergent and competing standards. OpenTelemetry is the latest effort, itself a unification of OpenCensus and OpenTracing.

Knative’s tracing support today only works with OpenCensus, but the OpenTelemetry community has given us tools for bridging just this sort of gap in our systems. In this post we’re going to focus on using Jaeger through a mix of OpenCensus and OpenTelemetry, but the broader lessons should apply no matter what tools you’re using.
Getting started
We’re going to assume that you have a cluster with Knative Serving and Eventing installed. If you don’t already have a cluster I recommend giving the Knative Quickstart a try, but in theory any setup should work.
Once we have Knative installed, we’re going to add the OpenTelemetry
operator
to our cluster, which depends on
cert-manager. Something to watch
out for while installing these two is that you’ll need to wait for
cert-manager’s webhook pod to start before you can install the operator, or else
you’ll see a bunch of “connection refused” errors creating certificates. Running
kubectl -n cert-manager wait --for=condition=Ready pods --all will block until
cert-manager is ready to roll. kubectl wait defaults to a 30 second timeout,
so it may take longer on your cluster depending on image download speeds.
kubectl apply -f https://github.com/jetstack/cert-manager/releases/latest/download/cert-manager.yaml &&
kubectl -n cert-manager wait --for=condition=Ready pods --all &&
kubectl apply -f https://github.com/open-telemetry/opentelemetry-operator/releases/download/v0.40.0/opentelemetry-operator.yaml
Next we’ll set up the Jaeger operator (yes, another operator, I swear this is the last one).
kubectl create namespace observability &&
kubectl create -f https://raw.githubusercontent.com/jaegertracing/jaeger-operator/v1.28.0/deploy/crds/jaegertracing.io_jaegers_crd.yaml &&
kubectl create -n observability \
    -f https://raw.githubusercontent.com/jaegertracing/jaeger-operator/v1.28.0/deploy/service_account.yaml \
    -f https://raw.githubusercontent.com/jaegertracing/jaeger-operator/v1.28.0/deploy/role.yaml \
    -f https://raw.githubusercontent.com/jaegertracing/jaeger-operator/v1.28.0/deploy/role_binding.yaml \
    -f https://raw.githubusercontent.com/jaegertracing/jaeger-operator/v1.28.0/deploy/operator.yaml
Once it's up we can create a Jaeger instance by running:
kubectl apply -n observability -f - <<EOF
apiVersion: jaegertracing.io/v1
kind: Jaeger
metadata:
  name: simplest
EOF
This may take a while to spin up, as we’re again waiting for the operator pod
and then the Jaeger pod itself to spin up. Once up, the Jaeger operator will
create a Kubernetes Ingress for our Jaeger, but since we’re running on Kind we
don’t have any ingress installed. No matter, a port-forward will suffice for our
purposes: running kubectl -n observability port-forward service/simplest-query
16686 will give us our Jaeger dashboard will be accessible on
http://localhost:16686.
Next we’re going to create the OpenTelemetry collector, which will be responsible for receiving traces from our programs and forwarding them to Jaeger. The collector is an abstraction that lets us connect systems that speak different protocols to each other. Even if we only export Zipkin traces we can rely on the collector to translate them into the form that Jaeger can consume. This collector definition will tell the OpenTelemetry operator to create a collector that will listen for traces as if it’s a Zipkin instance, but export them both to logs for debugging as well as to our Jaeger instance.
kubectl apply -f - <<EOF
apiVersion: opentelemetry.io/v1alpha1
kind: OpenTelemetryCollector
metadata:
  name: otel
  namespace: observability
spec:
  config: |
    receivers:
      zipkin:
    exporters:
      logging:
      jaeger:
        endpoint: "simplest-collector.observability:14250"
        tls:
          insecure: true

    service:
      pipelines:
        traces:
          receivers: [zipkin]
          processors: []
          exporters: [logging, jaeger]
EOF
If all is well we should now see 3 pods are running in the observability
namespace: our Jaeger operator, our Jaeger instance, and the OpenTelemetry
collector.
Finally we can configure Eventing and Serving to point all of their traces to our collector:
for ns in knative-eventing knative-serving; do
  kubectl patch --namespace "$ns" configmap/config-tracing \
   --type merge \
   --patch '{"data":{"backend":"zipkin","zipkin-endpoint":"http://otel-collector.observability:9411/api/v2/spans", "debug": "true"}}'
done
The debug flag here tells Knative to send all traces to our collector,
whereas in a real-world deployment you’d probably want to set a sample rate to
only get a representative subset of your traces.
Hello, world?
Now that our tracing infrastructure is all deployed and configured, we can start taking advantage of it by deploying some services. We can deploy the heartbeat image as a ContainerSource to test and see that everything is wired up correctly:
kubectl apply -f - <<EOF
apiVersion: sources.knative.dev/v1
kind: ContainerSource
metadata:
  name: heartbeats
spec:
  template:
    spec:
      containers:
        - image: gcr.io/knative-nightly/knative.dev/eventing/cmd/heartbeats:latest
          name: heartbeats
          args:
            - --period=1
          env:
            - name: POD_NAME
              value: "heartbeats"
            - name: POD_NAMESPACE
              value: "default"
            - name: K_CONFIG_TRACING
              value: '{"backend":"zipkin","debug":"true","sample-rate":"1","zipkin-endpoint":"http://otel-collector.observability:9411/api/v2/spans"}'
  sink:
    uri: http://dev.null
EOF
For right now this container will just be sending its heartbeats to the
non-existent domain http://dev.null, so if we look at the
logs for this pod we will see a bunch of DNS resolution errors. However if we
inspect the logs of our otel-collector pod, we should see that it’s
successfully receiving traces from our service. It’s good confirmation that our
configuration works, but not very exciting from a tracing perspective! Let’s
make it somewhat realistic by adding in a Knative service to receive our
heartbeats:
kubectl apply -f - <<EOF
apiVersion: serving.knative.dev/v1
kind: Service
metadata:
  name: event-display
spec:
  template:
    spec:
      containers:
        - image: gcr.io/knative-nightly/knative.dev/eventing/cmd/event_display:latest
          env:
            - name: K_CONFIG_TRACING
              value: '{"backend":"zipkin","debug":"true","zipkin-endpoint":"http://otel-collector.observability:9411/api/v2/spans"}'
EOF
We'll update our heartbeats service to start sending heartbeats here instead:
kubectl apply -f - <<EOF
apiVersion: sources.knative.dev/v1
kind: ContainerSource
metadata:
  name: heartbeats
spec:
  template:
    spec:
      containers:
        - image: gcr.io/knative-nightly/knative.dev/eventing/cmd/heartbeats:latest
          name: heartbeats
          args:
            - --period=1
          env:
            - name: POD_NAME
              value: "heartbeats"
            - name: POD_NAMESPACE
              value: "default"
            - name: K_CONFIG_TRACING
              value: '{"backend":"zipkin","debug":"true","zipkin-endpoint":"http://otel-collector.observability:9411/api/v2/spans"}'
  sink:
    ref:
      apiVersion: serving.knative.dev/v1
      kind: Service
      name: event-display
EOF
Once these services are deployed we can check back over at our Jaeger dashboard and we should see some more a more interesting trace:
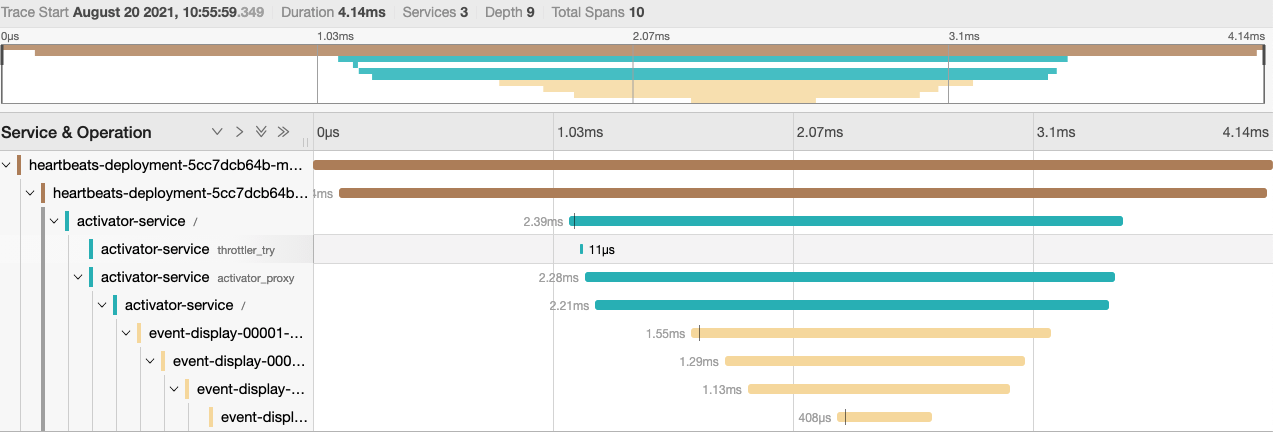
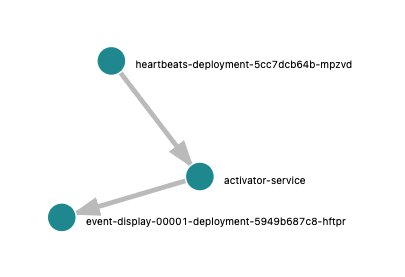
On the “System Architecture” tab of Jaeger we can also see a nice graph of our topology, including one component you may or may not know about, the activator:
This is a component that Knative Serving adds to the network path of Knative Service to buffer requests when our service isn’t ready to handle them as well as reporting request metrics to the autoscaler. You can also see that it adds a tiny penalty, around 2ms on my cluster. It’s possible to configure Knative so that the activator stays out of the path under different scenarios, but that’s a topic for another blog post :).
Getting fancy
Let’s make our topology a little more interesting by adding in some Knative bells and whistles. First, let’s start sending our messages through a Broker and Trigger instead of directly from our heartbeats service. We’ll create a broker and trigger that forward all messages to the event-display service, and reconfigure our heartbeat service to point to the broker:
kubectl apply -f - <<EOF
apiVersion: eventing.knative.dev/v1
kind: Trigger
metadata:
  name: heartbeat-to-eventdisplay
spec:
  broker: default
  subscriber:
    ref:
      apiVersion: serving.knative.dev/v1
      kind: Service
      name: event-display
---
apiVersion: eventing.knative.dev/v1
kind: Broker
metadata:
  name: default
---
apiVersion: sources.knative.dev/v1
kind: ContainerSource
metadata:
  name: heartbeats
spec:
  template:
    spec:
      containers:
        - image: gcr.io/knative-nightly/knative.dev/eventing/cmd/heartbeats:latest
          name: heartbeats
          args:
            - --period=1
          env:
            - name: POD_NAME
              value: "heartbeats"
            - name: POD_NAMESPACE
              value: "default"
            - name: K_CONFIG_TRACING
              value: '{"backend":"zipkin","debug":"true","zipkin-endpoint":"http://otel-collector.observability:9411/api/v2/spans"}'
  sink:
    ref:
      apiVersion: eventing.knative.dev/v1
      kind: Broker
      name: default
EOF
If we turn back to our Jaeger now, we should see a much more complicated trace, with many more hops from Eventing’s in-memory broker now in the path our messages take between heartbeat and event-display. If you’re using a different broker implementation your traces will be different, but in all cases we’re adding complexity to our system for the sake of increasing its flexibility and power.
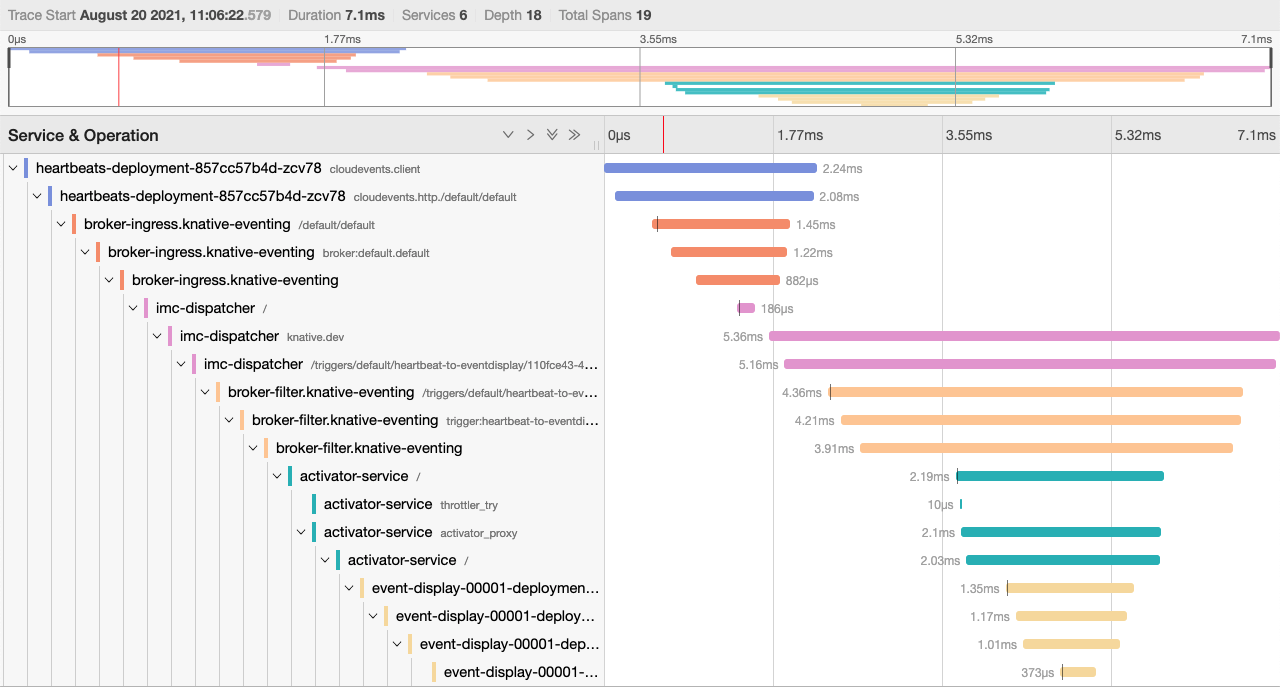
From here we can add another wrinkle to our deployment: instead of every heartbeat going straight to our event-display service, let’s flip a coin and only send it on if we get a “heads” back. Luckily for you I’m well-versed in numerological theory and have already coded up this coin-flipping microservice, so we can just deploy it as a new Knative service.
kubectl apply -f - <<EOF
apiVersion: serving.knative.dev/v1
kind: Service
metadata:
  name: coinflip
spec:
  template:
    spec:
      containers:
        - image: benmoss/coinflip:latest
          env:
            - name: OTLP_TRACE_ENDPOINT
              value: otel-collector.observability:4317
---
apiVersion: eventing.knative.dev/v1
kind: Trigger
metadata:
  name: heartbeat-to-coinflip
spec:
  broker: default
  subscriber:
    ref:
      apiVersion: serving.knative.dev/v1
      kind: Service
      name: coinflip
  filter:
    attributes:
      type: dev.knative.eventing.samples.heartbeat
---
apiVersion: eventing.knative.dev/v1
kind: Trigger
metadata:
  name: heartbeat-to-eventdisplay
spec:
  broker: default
  subscriber:
    ref:
      apiVersion: serving.knative.dev/v1
      kind: Service
      name: event-display
  filter:
    attributes:
      flip: heads
EOF
kubectl apply -f - <<EOF
apiVersion: opentelemetry.io/v1alpha1
kind: OpenTelemetryCollector
metadata:
  name: otel
  namespace: observability
spec:
  config: |
    receivers:
      zipkin:
      otlp:
        protocols:
          grpc:
    exporters:
      logging:
      jaeger:
        endpoint: "simplest-collector.observability.svc.cluster.local:14250"
        insecure: true

    service:
      pipelines:
        traces:
          receivers: [zipkin, otlp]
          processors: []
          exporters: [logging, jaeger]
EOF
If we examine the new trigger configuration we can see that now we have two triggers, one that sends all heartbeat type events to the coin-flipper, and then one that sends all events with the extension “flip: heads” to the event-display. The coin-flipping service clones the incoming heartbeat event, flips a coin and adds the result as a CloudEvents extension, and also changes the event type so we don’t accidentally spawn an infinite loop of coin flips. It then sends this event back to the broker to get requeued, which then either gets dispatched to the event-display on heads or dropped if the result was tails.
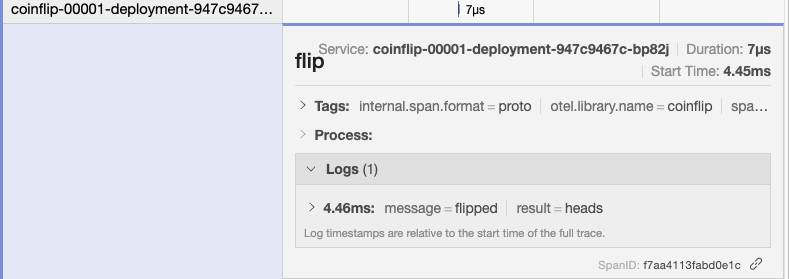
If we turn back to our Jaeger interface, we’ll see heartbeats traces of varying lengths, sometimes terminating on an unlucky tails, but sometimes winning the jackpot and forwarding on to the event-display. Examining the logs of the event-display we should see events still coming in, albeit at a slower rate than before, and all with the “flip: heads” extension. We’ll also see these custom spans that we are sending with our custom instrumentation from within the coin-flipper service.
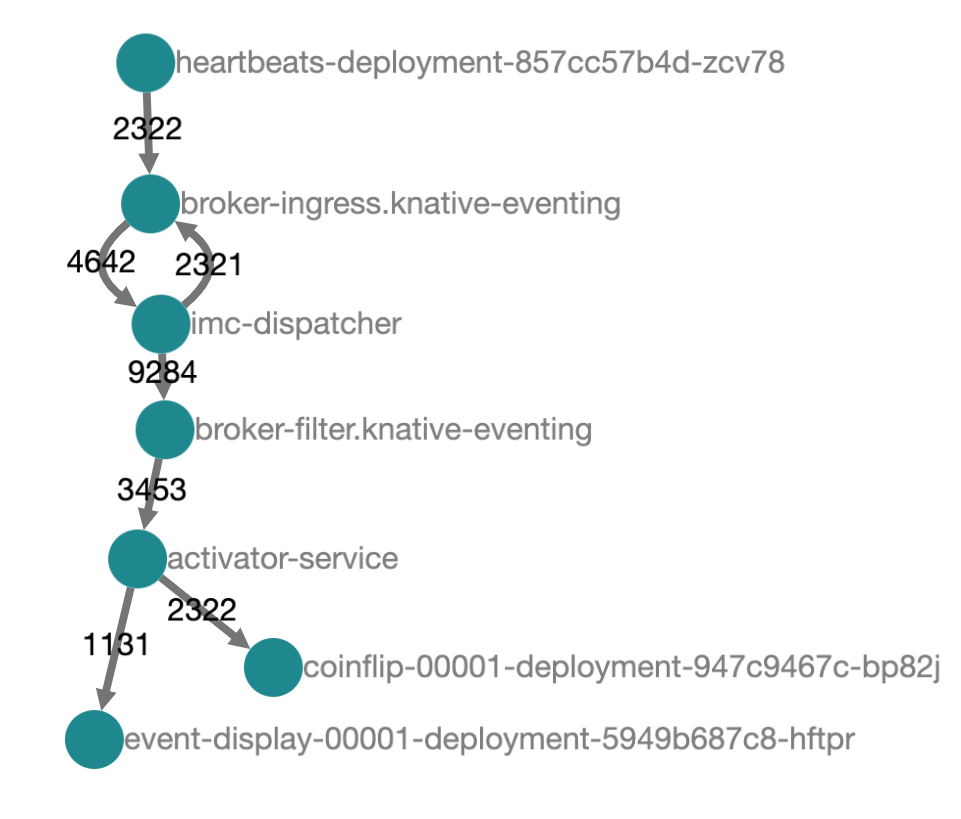
We can get a sense from Jaeger's architecture diagram what is happening here. Our events are flowing in from the heartbeats service, through the broker, and out to each of our triggers. The filters on our triggers mean that initially the events will only continue to our coinflip service. The coinflip service replies with a new event, which then flows back through the broker and filters, this time being rejected by our coinflip trigger but accepted by the event-display trigger.
Wrapping up
Hopefully through this all we learned a little bit about both Knative and the value of good observability tools. We saw how we can make good use of the OpenTelemetry Collector to integrate systems speaking different protocols and funnel them all to one shared Jaeger instance. The topology we created was in one sense trivial, but hopefully interesting and complex enough to point the way towards how you might structure real evented systems. The observability and metrics ecosystem is big and sometimes can feel overwhelming, but once it’s configured it can be a lifesaver in terms of understanding and troubleshooting your systems.